Information Design
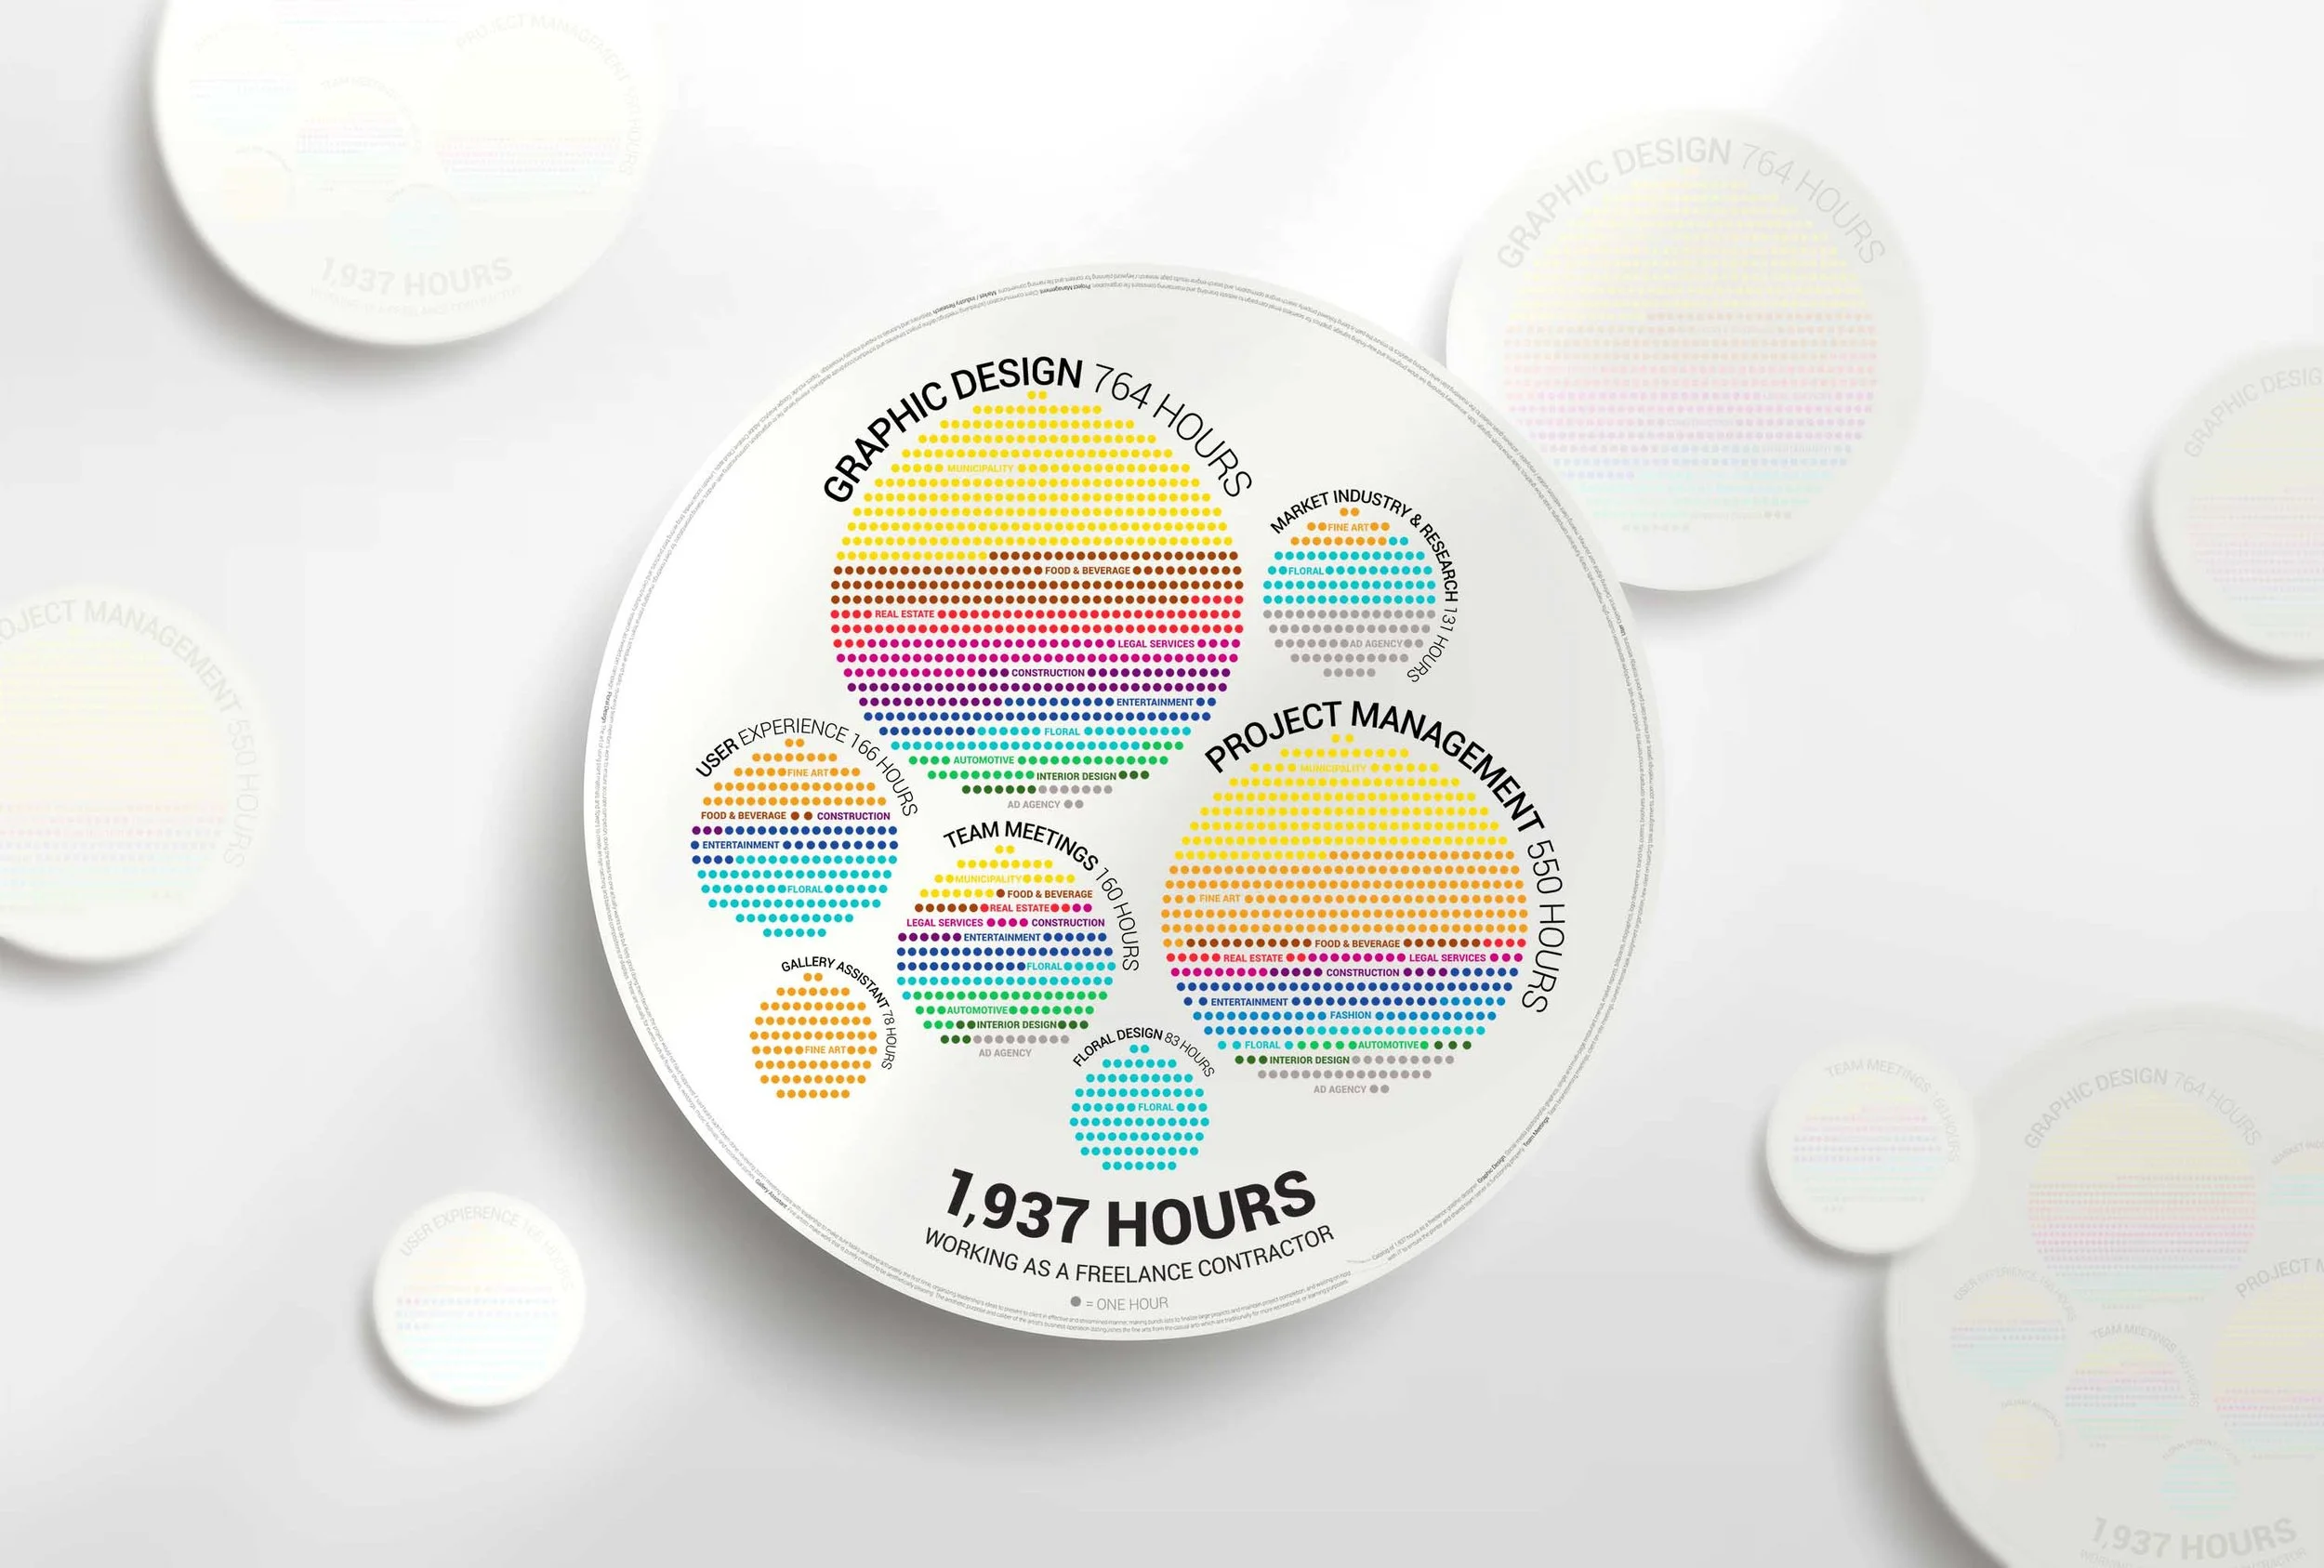
1,937 HOURS
The job of “Graphic Designer” comes with more assignments than just making logos, building social media graphics, and writing PowerPoint presentations. Designers make things happen. They empathize with the end user and connect the dots to problem solve along the way when things go wrong. Working on a team means being adaptive and finding joy in tending to the small details while also keeping the big picture in focus to ensure a project comes together successfully.
This infographic was tallied and organized after pulling data reports from time tracking apps that are commonly used for billing purposes. The range of industries and different task groups are displayed to show the volume of each task. The light gray circle encompassing the entire design are built with lists of specific tasks.


A LOT CAN HAPPEN IN 116,220 MINUTES
Expand each section to read examples of various responsibilities and learn more about the industries.
Assignments & Responsibilities
-
Social media posts/profile graphics, single and multi-page restaurant menus, market reports, billboards, infographics, logo development, brand guidelines, posters, brochures, company announcements, product mock-ups, employee appreciation custom gifts, magazine ads, charity fundraiser campaigns, trade show graphics, trade show booth signage, anniversary branding, live show programs and way-finding signage, graphics for seamless email campaign to website branding, and maintaining consistent file organization.
-
Client communication (scheduling meetings/define project timelines and schedules/coordinate deadlines), internal server file re-organization, communicating with vendors, making presentations for client meetings, managing internal team’s schedule and tasks, reviewing team member’s work to ensure accurate completion, doing the tasks no one actually wants to do but feels good doing them because the project would not have happened if said tasks hadn’t been done, reviewing zoom meeting notes with leadership to make sure tasks are done accurately the first time, organizing leadership’s ideas to present to client in effective and streamlined manner, making punch lists to finalize large projects and maintain project completion, and waiting on hold with IT to ensure the printer and shared team server is functioning properly.
-
Team brainstorming meetings, client on-site meetings, current internal task assignment organization, new client on boarding task assignments, zoom meetings galore, and internal client pain point strategy sessions.
-
Defining user journeys, making client websites usable / enjoyable / achieves goals related to the marketing plan while tracking analytics to ensure the path is being followed properly, search engine optimization, and search engine results page research / keyword planning for content and file naming conventions.
-
Participating in webinars, reading blogs, and watching video tutorials to expand industry knowledge. Topics include: Google Analytics, Adobe Creative Cloud apps, LinkedIn social media, blog writing best practices, and client/industry research as needed per campaign.
-
The art of using plant materials and flowers to create an eye-catching and balanced compositions or displays. These are usually for events such as flower shows, weddings, music festivals, and residential parties.
-
Working in a gallery is a hybrid of making the customer that walks in feel just as special as the one who finds you online. Communicating the story and the artist’s passion is a journey that everyone should enjoy and embrace to connect with the work.
Industry Details
-
A municipality is usually a single administrative division having corporate status and powers of self-government or jurisdiction as granted by national and regional laws to which it is subordinate. Working with a fundamental (and usually undervalued) part of our local government can be very rewarding when everyone works together. Many public servants want to be an agent of good and make a positive change in a community but they don’t quite have the technology knowledge to execute social media or ad campaigns effectively.
-
The creative arts, especially visual art, are to be appreciated primarily or solely for their imaginative, aesthetic, or intellectual content. The world of fine art is an ever changing sea of art, styles, and mediums. There’s so much that goes into what website platforms are best fit to sell the artwork, maintaining a high level of customer service so you get repeat customers, measuring twice and cutting once, and planning social content that represents the brand and pushes new products and creative activities.
-
The branch of manufacture and trade based on the building, maintaining, and repairing structures. More specifically, custom building services. These clients need sleek brochures paired with mobile-friendly and up-to-date websites to show how their work stands apart from the competition.
-
Real estate is any real property consisting of land and improvements such as fixtures and buildings. This type of work is corporate and minimal and lends itself to market reports, blog posts, and sharing successful client stories.
-
The Food and Beverage Industry includes companies involved in transforming raw agricultural goods into consumer food products. Product photography is only half the battle with hospitality clients. The atmosphere, social media engagement, Google Map Pack ranking, and an easy online ordering system need to working together to make sure they get tables filled every night of the week.
-
Marketing for a legal service has many challenges. The terminology used is complicated and unfamiliar to people outside of the industry and their clientele can be anyone. Planning content for informational webinars, social media announcements, and detailed blogs are of the utmost importance to drive traffic to the website. If this content is succinct they will be the authority to rank first in a Google search when the time comes for someone to hire their services.
-
Interior design is the art and science of enhancing the interior of a building to achieve a healthier and more aesthetically pleasing environment for the people using the space. Building an audience means showing what inspires the creative minds behind the scenes and what’s trending pushes the visual narrative
-
The fashion industry consists of four levels: the production of raw materials, principally fibers and textiles but also leather and fur; the production of fashion goods by designers, manufacturers, contractors, and others; retail sales; and various forms of advertising and promotion. Covid impacted the entire world and now the supply chain has had a terrible “trickle down” effect on smaller fashion designers around the world.
-
Making online reservations for event staging, luxury seating, and lighting decor is only half the battle. A clean e-commerce experience and connecting with the event photographer is key to the success of these businesses! If the products can be easily booked then its important to follow up with the customer to make sure the event went off without a hitch and then get the onsite photos from the live event to update the portfolio and showcase recent work on social media.
-
These companies are dedicated to creating, planning, and handling advertising / promotion and marketing for clients, usually on a monthly or project based retainer. As any business, they need to set aside time to update their own customer touch-points and ensure their social media channels and portfolios of accomplishments remain relevant and helpful to and future clients.
-
Everything. Is. Content. Staying relevant in the most recent social media algorithm is exhausting but at least the content is alive with the colors of the rainbow and there’s a lot of room for creative freedom in the campaigns.
-
From financing cars to selling maintenance packages, dealerships have a unique opportunity to keep customers coming back all year ‘round and make sure they see the latest model while their current car is being serviced. Detailed and approachable collateral is vital to advertising new packages to all customers that come through the door and make sure they come back.